
1. Highlights
- Despite market volatility and external pressures, Bitcoin demonstrated resilience, with a 54.1% year-to-date return, affirming its role as a stable investment asset.
- Key projects like Sui (SUI) and Aave (AAVE) saw exceptional returns of 116% and 71%, respectively, reflecting positive market dynamics.
- The Long/Short-Term Holder Supply Ratio indicates robust long-term holder accumulation, signaling strong confidence in Bitcoin’s value. Gradual improvement in the Short-Term Holder MVRV suggests an increasing likelihood of profitability for new market participants, indicating improving market sentiment.
- The stablecoin market cap grew by $11B (6.9%) to $171.9B, highlighting improved liquidity and a favorable investment environment in the crypto ecosystem.
2. Market Update
2.1. Market Performance
Q3 2024 saw significant volatility, driven by creditor repayments, market selling from key entities, and macroeconomic factors like the Yen-carry trade. Despite these challenges, Bitcoin remained resilient, highlighting the asset’s stability amidst turbulent times. The macro backdrop included a notable 50-basis point interest rate cut by the Federal Reserve in September, the first reduction in four years, which sparked volatility but also optimism in the technology and crypto markets.
Top performers:
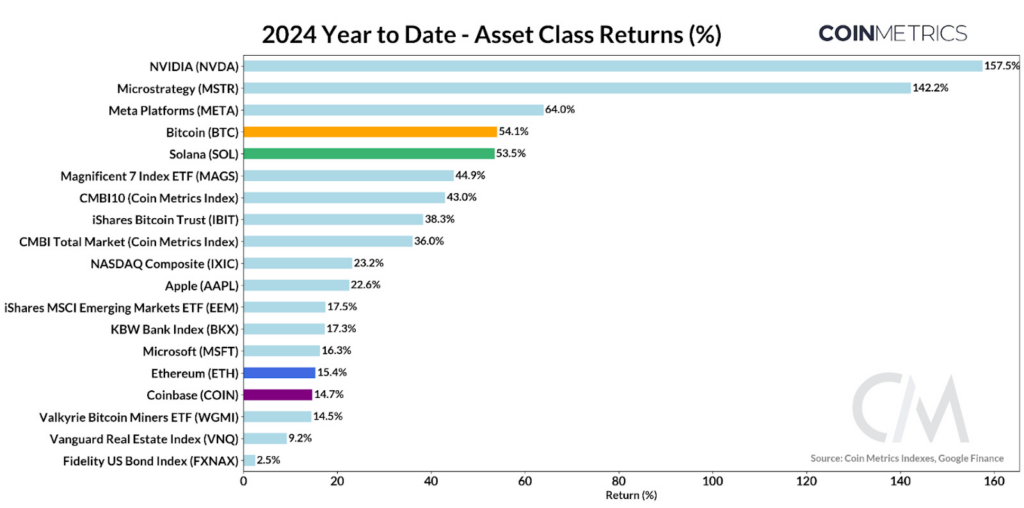
- Bitcoin (BTC) was the standout performer in the crypto space, with a 54.1% YTD return, reflecting its growing status as a strong investment vehicle even in uncertain conditions. Following closely behind was Solana (SOL) at 53.5% YTD, benefiting from increasing ecosystem activity. Outside of cryptocurrencies, MicroStrategy (MSTR) achieved a staggering 142.2% YTD return, driven by its aggressive strategy of accumulating Bitcoin.
- NVIDIA took the lead in the broader asset class with a 157.5% YTD return, continuing to capitalize on the AI-driven boom. Meta Platforms (META) and Magnificent 7 Index ETF (MAGS) also posted impressive returns of 64% and 44.9%, respectively, reflecting the continued bullish sentiment around tech stocks.
- Ethereum (ETH), while still a critical infrastructure player in DeFi and NFT ecosystems, underperformed relative to Bitcoin, returning 15.4% YTD. Its ETF introduction in August failed to draw significant capital inflows, particularly when compared to Bitcoin ETFs, as on-chain activity remained low. This signals the market’s struggle to balance Ethereum’s scaling roadmap with value accrual to ETH itself.
Performance of Top 30 Crypto Assets
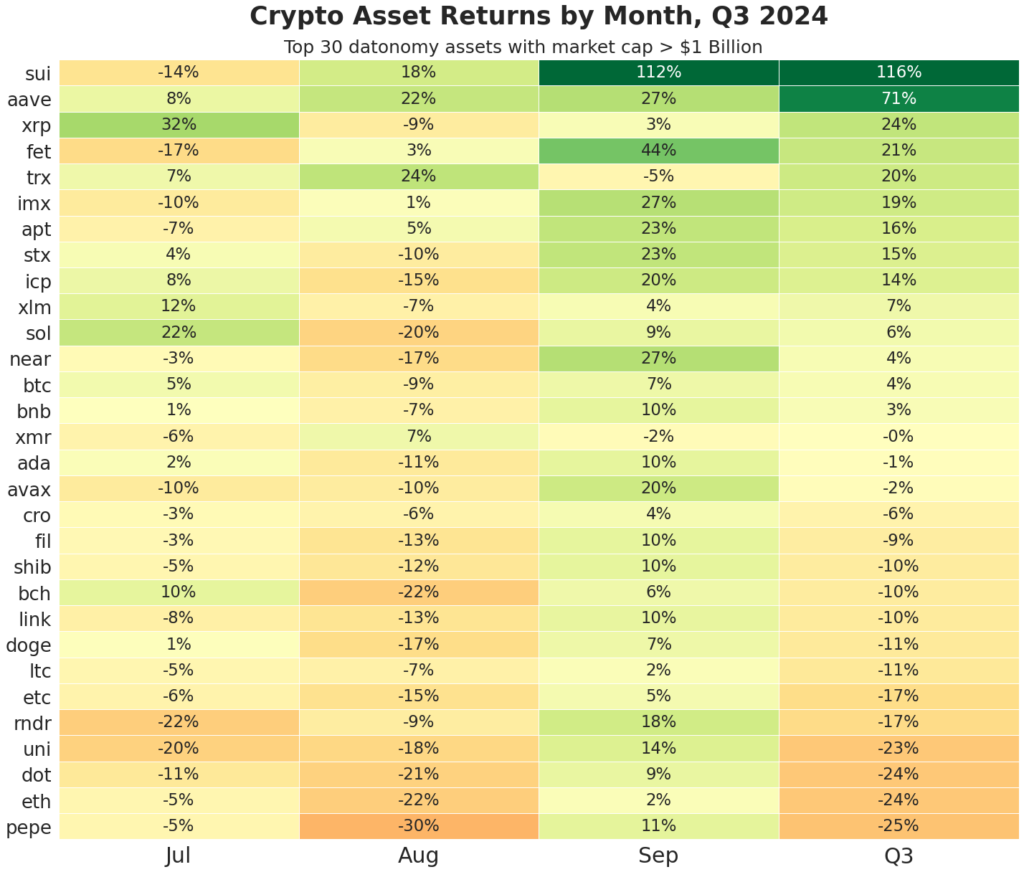
During Q3 2024, the performance of the top 30 crypto assets with a market cap exceeding $1 billion revealed substantial growth driven by fundamental tailwinds. Key projects such as Sui (SUI) and Aave (AAVE) showcased significant returns, reflecting positive market dynamics and strong underlying fundamentals.
- Sui (SUI): This high-throughput Layer-1 blockchain achieved an impressive 116% return in Q3. Key drivers of this performance included the Mysticeti upgrade, the launch of Grayscale’s Sui investment fund, and the integration of USDC stablecoin, which enhanced liquidity and increased network activity.
- Aave (AAVE): The DeFi protocol surged 71%, propelled by innovative governance proposals and a resurgence of DeFi liquidity, underscoring the sector’s recovery potential.
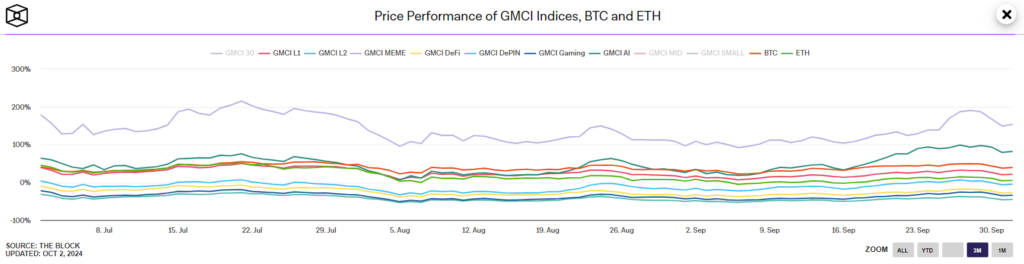
2.2. Sector Performance
- The MEME sector’s performance suggests a resurgence of speculative interest in meme tokens. These assets often rise rapidly based on community sentiment and speculative trading rather than fundamental value.
- The strong performance of the AI sector reflects increasing investor interest in blockchain-based AI solutions. Additionally, the sector is fueled by Kamala Harris’s commitment to publicly support the growth of crypto and AI if elected as the next U.S. President.
2.3. Bitcoin
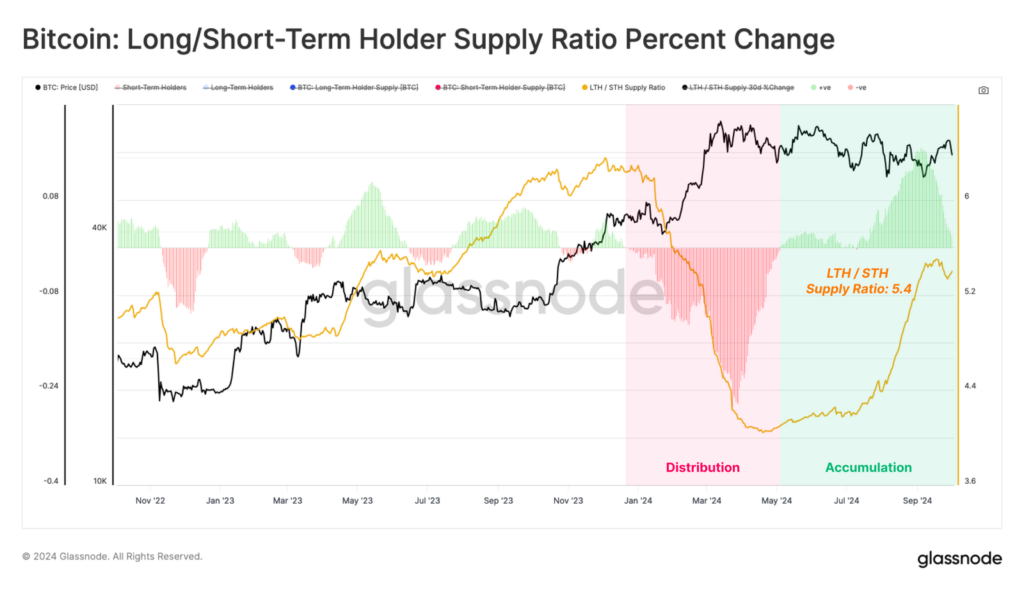
Long/ Short-Term Holder Supply Ratio Percent Change
The Long/Short-Term Holder Supply Ratio Percent Change provides insights into the balance between accumulation by long-term investors and speculation by short-term traders. A rising ratio, especially with a positive percent change, typically suggests that the market is in an accumulation phase, with increasing long-term conviction, while a declining ratio with a negative percent change may signal a distribution phase, potentially leading to higher market volatility.
The chart shows that in Q3 2024:
- The dominance of long-term holders throughout Q3 2024 suggests that investor confidence in Bitcoin’s long-term value remains robust. The continued accumulation by these holders, as shown by the rising LTH/STH ratio, is a significant bullish signal for future price appreciation.
- The declining activity of short-term holders implies that speculative behavior has decreased. This reduces market volatility and supports a more stable price environment, where price moves are more likely to be driven by long-term macro factors than short-term trading events.
- The accumulation phase observed during Q3 2024 is historically associated with pre-bullish market conditions. As long-term holders continue to amass Bitcoin, the available circulating supply decreases, leading to potential supply shocks that can drive future price rallies.
- Moving forward, the continuation of this accumulation behavior by long-term holders is a positive signal for Bitcoin’s future. If demand picks up in subsequent quarters, combined with a reduced supply from long-term HODLers, a supply-demand imbalance could trigger significant price increases.
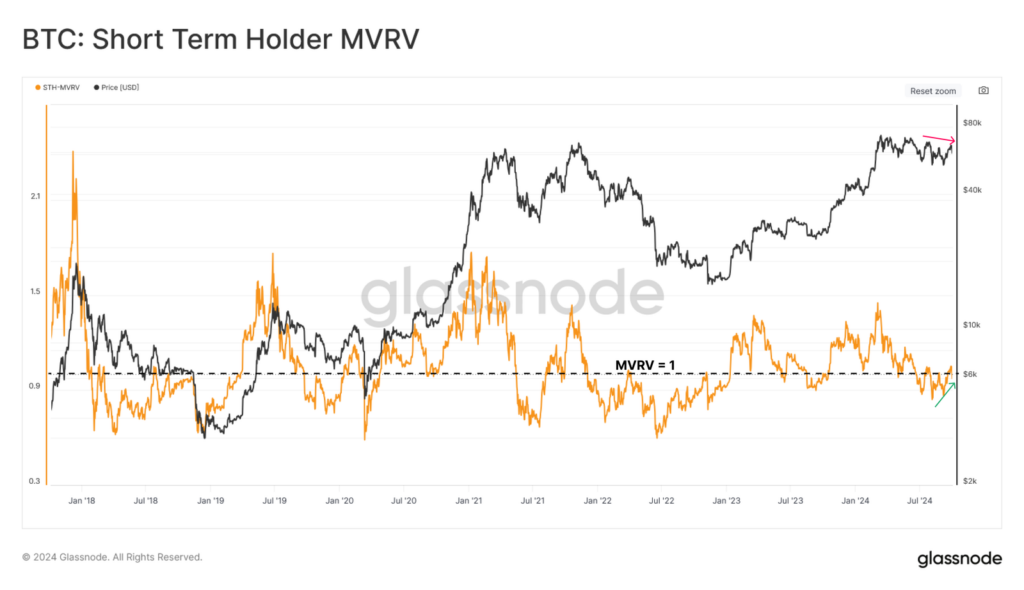
Short Term Holder MVRV (Market Value to Realized Value)
Definition: The Short-Term Holder MVRV measures the average unrealized profit or loss of short-term holders. This is critical because it represents a pool of new market participants and speculative traders who tend to be more responsive to market volatility compared to long-term holders (LTH). These short-term holders are often the ones who add liquidity to the market and contribute to immediate price movements, making this metric a key indicator for near-term price action.
The chart shows that in Q3 2024:
- The STH MVRV dipped below the equilibrium value of 1 several times, signaling that short-term holders were, on average, holding at a loss. This often occurs during periods of uncertainty or consolidation, where new buyers enter the market but are not immediately in profit due to sideways price action.
- However, a notable trend emerges as the MVRV ratio begins to increase gradually toward the end of Q3 into Q4 2024. This positive divergence occurs while Bitcoin’s price remains relatively flat, signaling that although prices haven’t risen sharply, short-term holders are increasingly moving toward profitability.
- In addition, the undercutting of the MVRV below 1 in Q3 2024 differs from previous bear market cycles like those seen in 2022. The depth and duration of this undercutting are less severe, indicating that short-term holders are not facing the same financial stress as they did in previous bear markets.
The positive divergence—where the price stays flat but the STH MVRV rises—suggests that newer market participants are either buying Bitcoin at a lower average cost basis or that the existing short-term holders are holding onto their positions despite unrealized losses. This is a potential sign of improving sentiment and confidence in Bitcoin’s price stability.
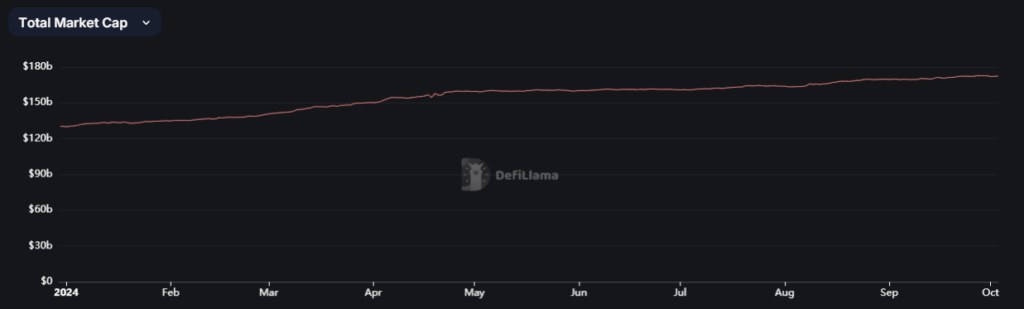
2.4. Stablecoin
After a period of consolidation in Q2, stablecoin market capitalization showed positive momentum in Q3.
The total stablecoin market capitalization grew by $11B (+6.9%) in Q3, rising from $160.9 billion to $171.9 billion. This increase signals enhanced market liquidity and greater capital availability within the crypto ecosystem. Such growth reflects a more favorable environment for investment in crypto projects, indicative of a positive sentiment among investors.
3. Conclusion
Q3 2024 showcased a mixed sentiment in the cryptocurrency market, with Bitcoin and Solana’s strong performances demonstrating the resilience of digital assets. MicroStrategy’s success in accumulating Bitcoin further emphasized this trend. However, Ethereum’s weaker performance and the sluggishness of newer ETFs reveal ongoing challenges in DeFi and digital asset adoption.
As we approach Q4, factors such as institutional participation, regulatory clarity, and macroeconomic shifts are expected to play crucial roles in driving bullish market sentiment.
The information provided in this article is for reference only and should not be taken as investment advice. All investment decisions should be based on thorough research and personal evaluation.


