
TL;DR
The U.S. Tariff 2.0 is broader and harsher than the 2018-2019 tariffs, but its primary target remains China. This will impact GDP, inflation, investment, and employment, leading to significant industrial restructuring and a reshaping of the global landscape and alliances.
Beyond tariffs, each side’s negotiating leverage includes economic, security, and technological factors, with varying degrees of emphasis. Currently, China shows no signs of yielding, while the U.S. has granted a 125% reciprocal tariff exemption on electronic goods. This suggests the U.S. trade war strategy is facing considerable pressure from major U.S. tech companies due to their predominantly offshore manufacturing.
The U.S. is playing a high-risk game amidst uncertain economics (sticky inflation, growth slowdown, rising stagflation and recession risks, and bond market turmoil), making U.S. risk a catalyst for global instability.
Both sides are aware of each other’s vulnerabilities: China accounts for 52% of U.S. soybean export market share, 88% of rare earth import volume, 38% of gallium imports, and 59% of graphite imports. However, Chinese chip manufacturers are entirely reliant on imports of EDA and semiconductor fabrication equipment from top U.S. chip tool makers like Synopsys, Cadence, KLA, and Lam Research.
The base case is that the U.S. will unilaterally reduce tariffs and initiate negotiations (in Q2) given the $582.4 billion bilateral trade volume last year. Prolonged order disruptions would inflict significant losses on businesses and further destabilize the macroeconomy.
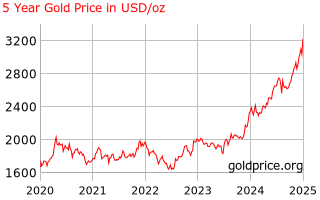
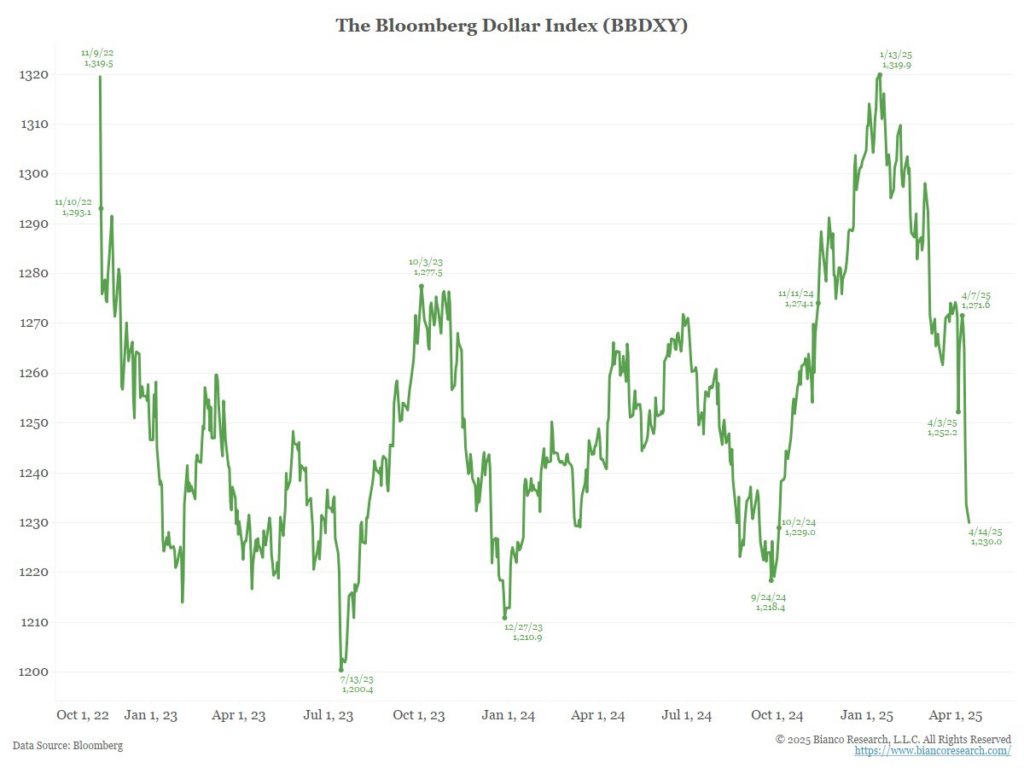
News of a new round of U.S.-China talks will provide a short-term boost to the market. However, the strong rise in gold prices and the weakening of the USD against major currencies indicate a precarious U.S. economic outlook. Consequently, the commodities group is attracting safe-haven flows, while Bitcoin is only experiencing a short-lived benefit (a bounce to the 90,000s) without sustained upward momentum.
Emerging Asia is within the “Damage Zone”, particularly export-oriented growth models like Vietnam, Thailand, and Taiwan. Their emerging market currencies (VND, THB, KRW) will be under pressure in a prolonged trade shock scenario.
Winners include Mexico and India, benefiting from supply chain realignment and lower tariffs. Increased investment flows, factory relocation, and trade diversification are expected to accelerate in these regions.
Losers are manufacturing sectors (electronics, automotive, textiles, and industrial goods), all hit by input cost spikes and reduced demand.
News about a new round of negotiations between the U.S. and China will likely provide a short-term boost to the market. However, the strong appreciation of gold and the depreciation of the USD against major currencies suggest an uncertain outlook for the U.S. economy. As a result, the commodities group is attracting safe-haven flows, while Bitcoin’s gains are likely to be short-lived (expect a bounce into the 90,000s) without a significant sustained rally.
Emerging Asia, particularly export-oriented economies like Vietnam, Thailand, and Taiwan, will fall into the “Damage Zone.” Their emerging market currencies (VND, THB, KRW) will face pressure in a prolonged trade shock scenario.
Mexico and India are positioned as winners, benefiting from the redirection of supply chains and lower tariffs. Anticipate an acceleration in investment flows, factory relocations, and trade diversification towards these nations.
The losers will be manufacturing sectors, including electronics, automotive, textiles, and industrial goods, all of which will be impacted by rising input costs and decreased demand.
1. U.S. Tariff Then vs Now Summary
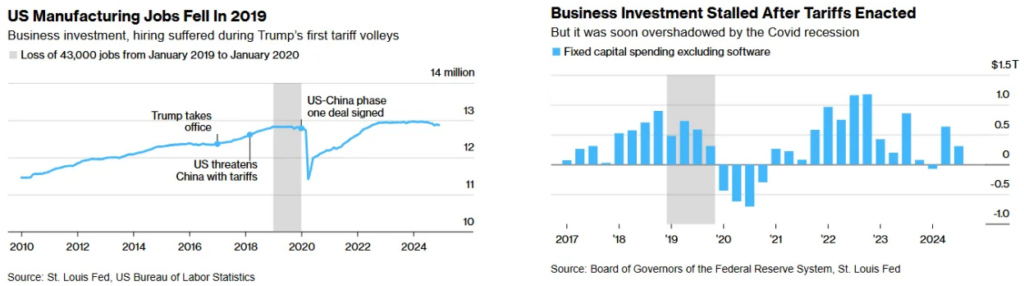
The U.S. in 2019 experienced low unemployment and controlled inflation (below the 2% target). This favorable macroeconomic backdrop provided the Federal Reserve the flexibility to cut interest rates as a proactive measure against the potential negative impacts of rising tariffs.
| Metric | 2018 – 2019 Tariff Era | 2025 Current Outlook |
| Tariff Scope | 25% on $370B Chinese imports (including semiconductors, electronics, machinery, and consumer goods) | 10% across most trade partners & 145% with China (applied to a broader range of products) |
| Fed Fund Rate | 2.5% → 1.75% (frist cut from July 2019) | 4.25%–4.50% (hesitant to cut amid sticky CPI) |
| Core Inflation | 1,6% (below target 2%) | Elevated 3–3,5% – risk of spike |
| Labor Market | Strong and UR low | Decelerating (tight but cooling) |
| Growth Response | Manufacturing recession & Capex slowdown | Similar risks + amplified due to scale |
| Fed’s Stance on Tariffs | Prioritize growth | Divided: balance inflation optics vs growth |
Consequence of Tariffs in 2019
Emerging Markets Volatility
Export-reliant economies such as Vietnam, Thailand, and Taiwan experienced demand shocks. Increased foreign exchange volatility led to higher debt servicing costs, which in turn intensified capital outflows. Notably, Emerging Markets Asia ETFs saw a -12% decline in 2019 during periods of tariff tensions, and emerging market currencies depreciated by an average of 8–12%.
Global Trade Growth Collapsed
The trade war in 2019 resulted in a contraction of global trade growth. Moody’s Analytics estimated that this shaved approximately 0.3% off the U.S. GDP and around 0.6% of the Chinese GDP. Furthermore, World Bank modeling from 2023 suggests that a full-scale tariff war could lead to a 2.1% reduction in global output, equivalent to roughly $2 trillion.
| Metric | Pre-War Peak | 2019 Value | Source |
| Global Trade Growth (YoY) | 4.3% (2017) | 0.30% | WTO, World Bank |
| U.S.–China Bilateral Trade Volume | $659B | $558B | U.S. Census Bureau |
| U.S. Manufacturing PMI | 60.8 (2018) | 47.8 | ISM |
| Global FDI Inflows | $1.49T | $1.39T | UNCTAD |
Winners and Losers in Trade Diversion
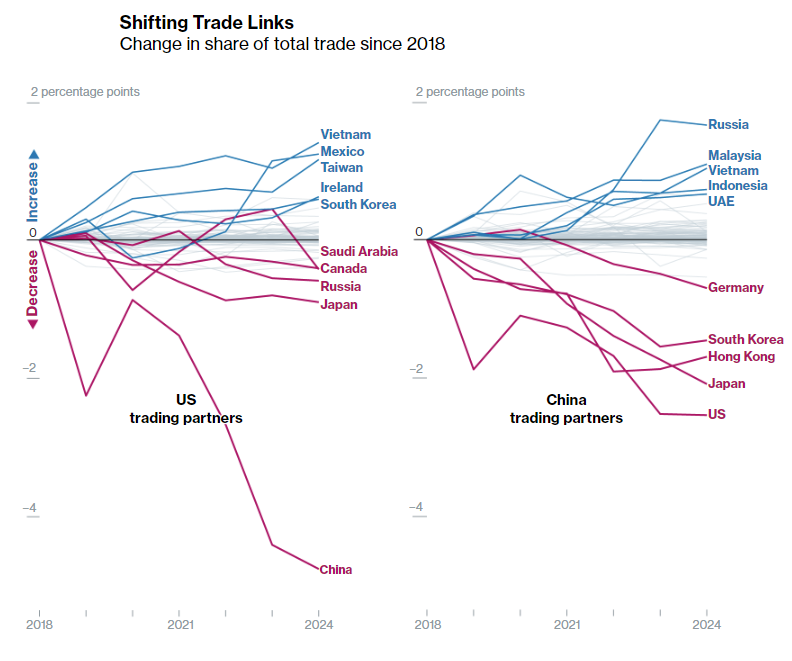
China has increased its sales to Southeast Asia (ĐNA) & Russia, while reducing trade with the U.S. From 2018 to 2024, the U.S.’s share in China’s total trade decreased from 13.7% to 11.2%. Notably, in 2019, third countries, primarily ASEAN, absorbed $21 billion worth of Chinese exports that were previously destined for the U.S. This suggests that China was less affected by the previous round of tariffs and remains the largest goods exporter globally.
| Country | Export Growth to U.S. (2019–2020) | Key Sectors Gaining |
| Vietnam | ↑35% | Electronics, furniture, garments |
| Taiwan | ↑21% | Semiconductors, precision machinery |
| Mexico | ↑11% | Autos, electronics |
| Bangladesh | ↑12% | Apparel |
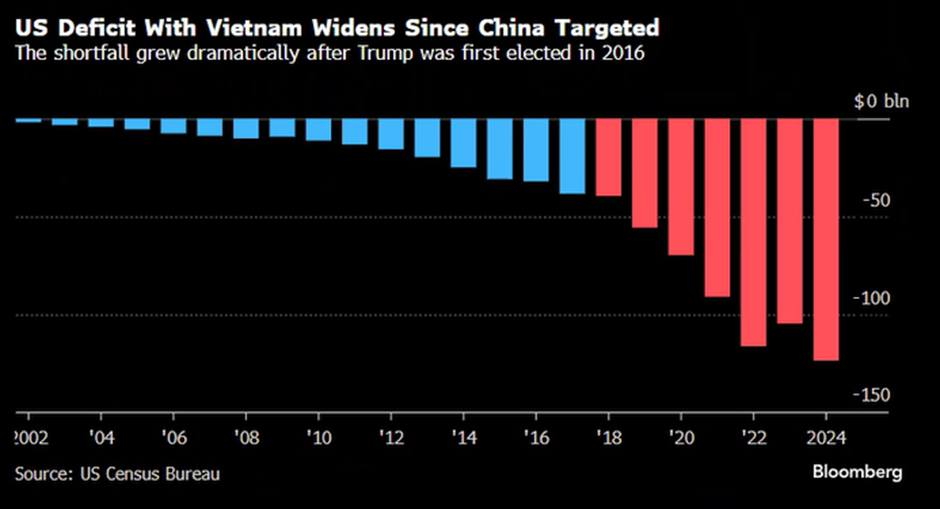
- Vietnam’s exports to the U.S. experienced the highest year-over-year growth among major trading partners in 2019, at 36%. It’s worth noting that Vietnam and Mexico are leading in trade with the U.S., partly due to their role as indirect channels for China.
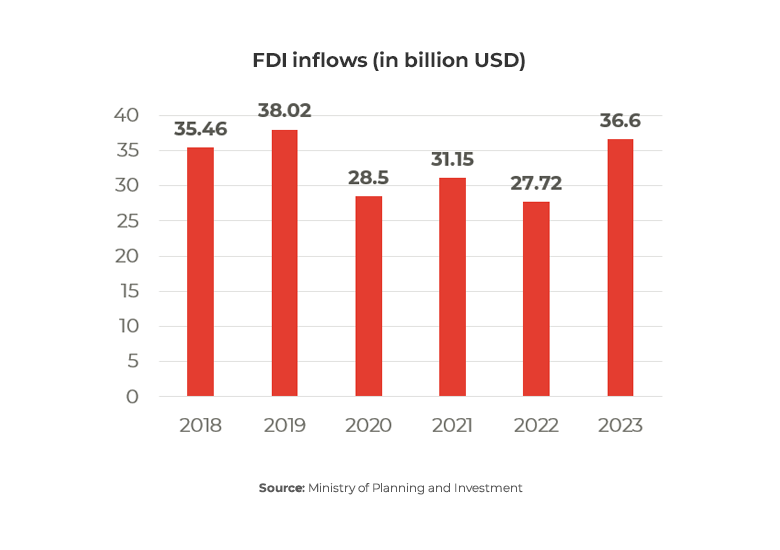
- Vietnam, Mexico, and Malaysia all witnessed a rise in FDI. In Vietnam’s case, FDI inflow jumped by 7.2% year-on-year in 2019, with the electronics and textile sectors attracting the most investment.
U.S. Tariff Now
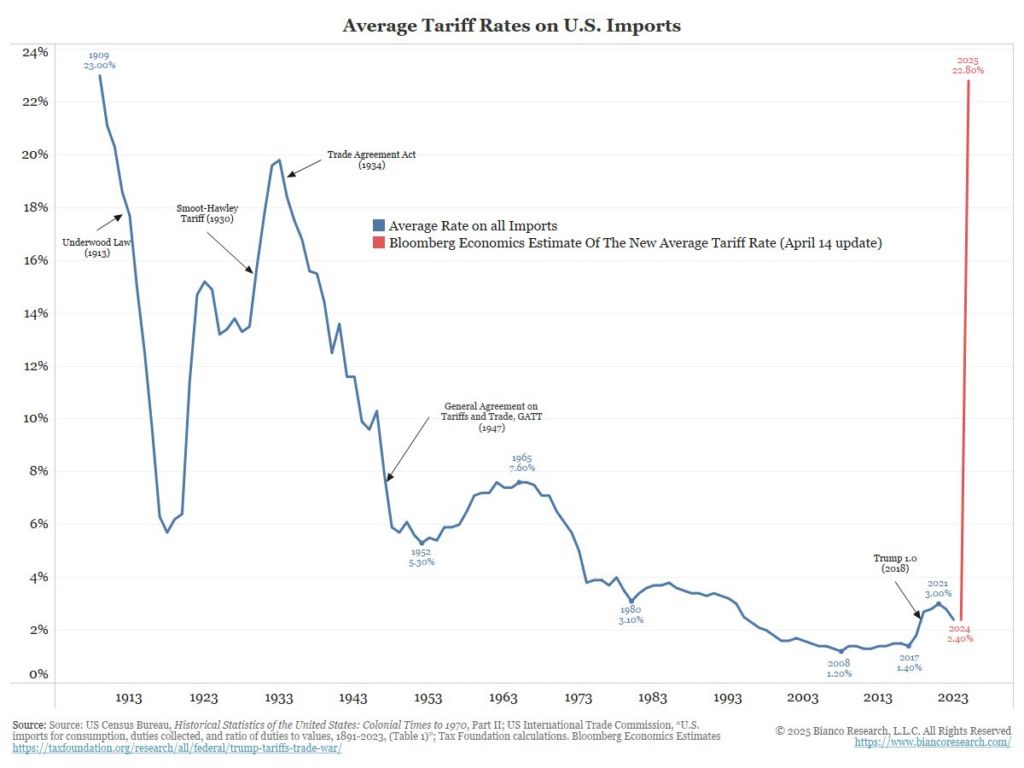
The U.S. trade-weighted average tariff has sharply increased from 2.4% to 22.8% (a tenfold increase in some sectors like aluminum, steel, and automobiles). Notably, the 2018 tariffs on Chinese steel and aluminum led to a 20% rise in the U.S. construction material prices and added an estimated $3 billion in annual costs for U.S. auto manufacturers (CRS Report, 2020).
U.S. Recession: A Catalyst for Global Instability
Tariff economic effects
- Higher Prices → Lower Demand → Lower Growth → Lower Earnings → Market Repricing.
Tariffs do not cause an immediate recession, but they significantly increase the probability of one due to their cumulative effects (higher inflation, reduced consumer spending, and constrained business investment). The probability of a U.S. recession is estimated at 60% (reports from J.P. Morgan & Goldman Sachs).
| Effect Category | Impact / Macro Outcome | Quantitative estimates based on historical models |
| Inflation (Cost-Push Effect) | Raise import prices & consumer price domestically ->Sticky inflation ->Stagflation Risk Rises (higher prices + slower growth + volatile trade flows) | +0.3–0.5% to core goods CPI over 12 months per 10% increase in tariffs (Cleveland Fed estimates) 20% price spike in U.S construction (CRS Report 2020, from Trump’s 2018 tariffs on Chinese steel & aluminum) |
| Real Consumption (Consumer Spending) | Consumer Purchasing Power Falls as Real Incomes Are Squeezed | U.S consumers bore 98% of tariff costs with annual cost at ~$800 per household (Federal Reserve Bank of New York, 2020) |
| Corporate Margins & Earnings | Corporate Earnings Drop as cost pressure grow | +5-10% input cost for U.S manufacturers with 25% tariffs on Chinese components (The Peterson Institute) |
| Real Business Investment | Delay in business investment & recruitment (Capex freezes & Productivity Hit) | -1.5% U.S. business investment YoY in 2019 |
| Employment | Export-oriented jobs at risk in sectors like agriculture, semis, consumer electronics | -43,000 factory jobs lost post-tariff imposition |
| Real GDP | Slowdown due to consumer increasingly worried about their savings and their jobs | -0.14% GDP per +1% tariff (Fed Model, 2018) |
| Equity Market Volatility | Causes risk-off moves & tightens financial conditions | MSCI EM fell -16% peak-to-trough during the 2018–19 U.S-China trade war |
| Global Systemic Risk | Global Trade Contraction Risk Global GDP Drag Global FDI slowdown due to trade wars reduce trade volume, investment flows, and global demand. | Cut global GDP by 0.6% in 2019 (IMF modeling, 2020) Rose 8–12% in U.S. inventory-to-sales ratios in affected sectors at 2018–2019 tariff wave. |
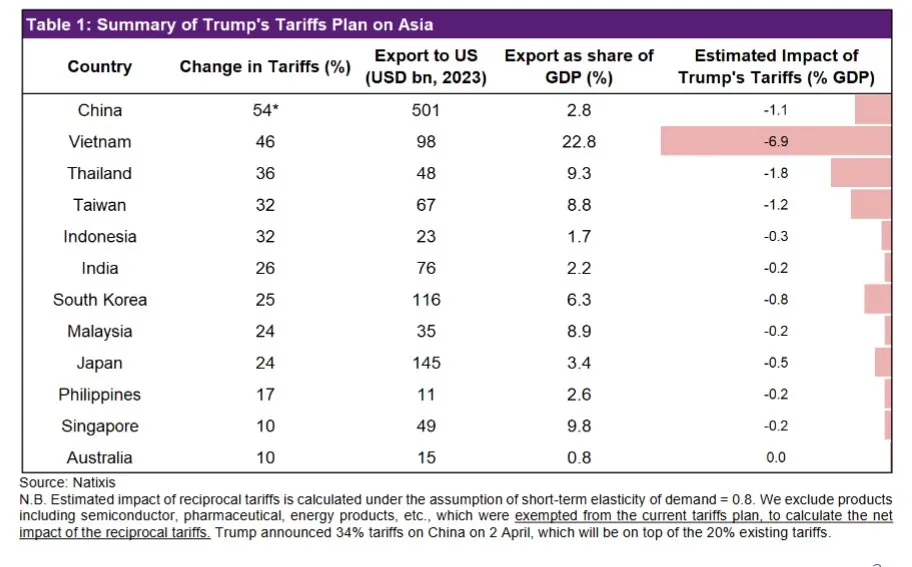
Impact of reciprocal tariffs (if maintained) on Asian countries
Vietnam would be the most significantly affected (estimated GDP reduction of 6.9%) due to its annual exports of $136 billion to the U.S., accounting for 30% of its total export turnover. Consequently, with a 46% tariff, Vietnamese goods will face significant competitive disadvantages (the textile, footwear, and electronics sectors will be heavily impacted), potentially leading to a 20-30% decrease in revenue. This could result in companies losing orders, workers losing jobs, and domestic commodity prices increasing due to the depreciation of the Vietnamese Dong (VND).
U.S. Top Imported Products from Key Asian Trading Partners
Despite potential negotiations that could lower tariffs to 20%, Vietnam’s export industries, industrial real estate, and oil & gas sectors are still expected to face considerable headwinds. This points towards a bearish forecast for these parts of the economy in the current year.
| Country | Industry Most at Risk | Outlook |
| China | Game consoles, PC monitors, Toys, Smartphones, Lithium-ion batteries | 🟠 Moderate Risk |
| Vietnam | Electronics & components, Furniture, Footwear & textiles | 🚨 Highly Vulnerable |
| Japan | Vehicles, machinery, electronics | 🟢 Limited Impact |
| South Korea | Semiconductors, electronics, automotive components | 🟢 Limited Impact |
| Malaysia | Electronics, machinery, palm oil | 🟢 Limited Impact |
| Thailand | Electronics, vehicles, machinery | 🟠 Moderate Risk |
| Indonesia | Textiles, footwear, electronics | 🟢 Limited Impact |
| Philippines | Electronics, machinery, agricultural products | 🟢 Limited Impact |
| Taiwan | Semiconductors, Electronics | 🟢 Resilient |
2. Next Economic Weapons – Possible Next Step
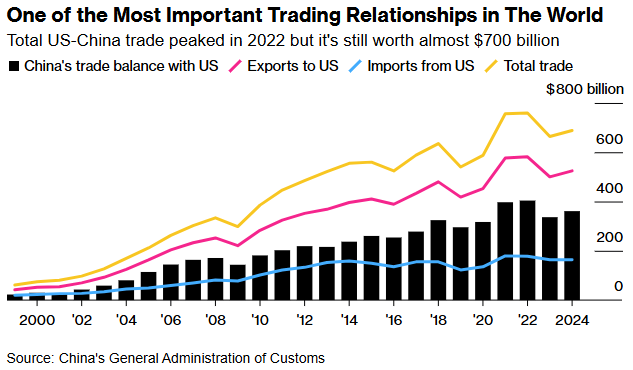
The annual trade volume between the U.S. and China is nearly $700 billion. Specifically, last year:
- Smartphones, laptops, and lithium-ion batteries were the top three largest import categories for the U.S. from China (China exports over $100 billion worth of electronics to the U.S.).
- Liquefied petroleum gas, soybeans, gas turbines, and semiconductor manufacturing machinery were the most valuable U.S. export categories to China.
It’s important to note that the trade deficit with China is the largest among all U.S. trading partners (reaching $295 billion in 2024).
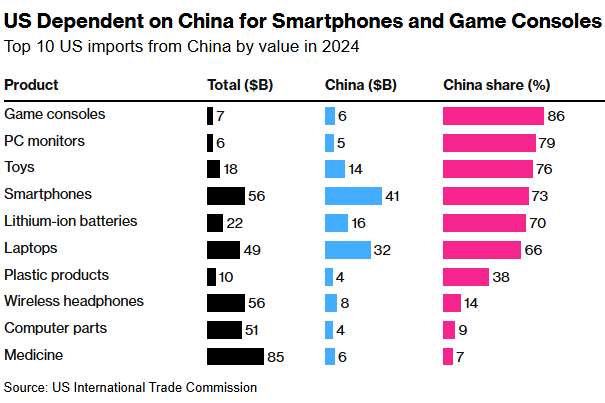
U.S. dependence on China is evident in key consumer goods like smartphones and game consoles. More broadly, the U.S. exhibits a high level of reliance on imports from China, with complete dependence on specific goods like toasters, various chemicals, vitamins, and LED lights. This suggests that the U.S. may need to offer concessions in the future.
Each Side’s Negotiating Cards: Strategic Leverage Matrix
Beyond tariffs, the other tools/weapons on both sides can leverage in negotiations spanning economics, security, technology, tourism, etc. On China’s side, these could include:
- Easing oversight of Chinese investments in the U.S. and vice versa (similar to the Obama era when bilateral foreign direct investment surged).
- Relaxing the technology and systemic restrictions that the U.S. is currently imposing.
If no agreement is reached, China will use economic tools to counter U.S. tariff, including devaluing the RMB (USD/CNY ratio exceeding 8), selling USTs (U.S. Treasury securities), halting soybean imports, or stopping rare earth exports (commodities where China holds a significant market share).
| Economic Tool | Who Can Deploy | Effectiveness | Likely Usage | Implications |
| Currency Devaluation | China | ★★★★☆ | High | Boost exports |
| Export Controls (Tech & Chips) | U.S | ★★★★★ | Ongoing | Limits China’s AI/semiconductor rise |
| Treasury Dumping (Sell USTs ~$759B) | China | ★★☆☆☆ | Tactical | Would raise U.S. rates but hurt China more |
| Delisting or Financial Sanctions | U.S | ★★★☆☆ | Conditional | Used on China-linked firms/banks |
| Critical Raw Material Embargoes | China | ★★★★☆ | Likely | Dominates rare earths, graphite, gallium -> Strategic blow to tech supply chains |
| Foreign Investment Restrictions | Both | ★★★☆☆ | Medium | Mutual FDI freeze slows capital flow |
| Cyber & Data Sovereignty Barriers | Both | ★★★☆☆ | Rising | Fragment global platforms & tech stacks |
| Sanctions on Defense-Affiliated Entities | U.S | ★★★★☆ | Already in play | China counters with its own list |
| Allied Coordination Power | U.S | ★★★★☆ | High | G7 + Quad (India-Japan-AUS) leverage against China |
3. Investment Impact Across Asset Classes – Strategic Positioning
- In the event of Scenario A, a 30% likelihood of Cold War 2.0, the recommended investment positions are: Buy Gold, Buy India/Mexico equities, and Sell Asian Export Foreign Exchange (VND, TWD).
- Scenario B
With a 50% probability of a Detente scenario, the suggested investment strategy is: Long Emerging Markets Asia equities, with Bitcoin benefiting from continued liquidity tailwinds due to a weakening dollar. Target a Bitcoin bounce into the 9x zone.
- Scenario C: Financial War Escalation (assigned a 20% probability). Recommended investment strategy: Establish long positions in Gold and Bitcoin; establish short positions in Chinese equities; anticipate increased buying pressure on safe-haven currencies (JPY, CHF), leading to their appreciation.
The information provided in this article is for reference only and should not be taken as investment advice. All investment decisions should be based on thorough research and personal evaluation.


