
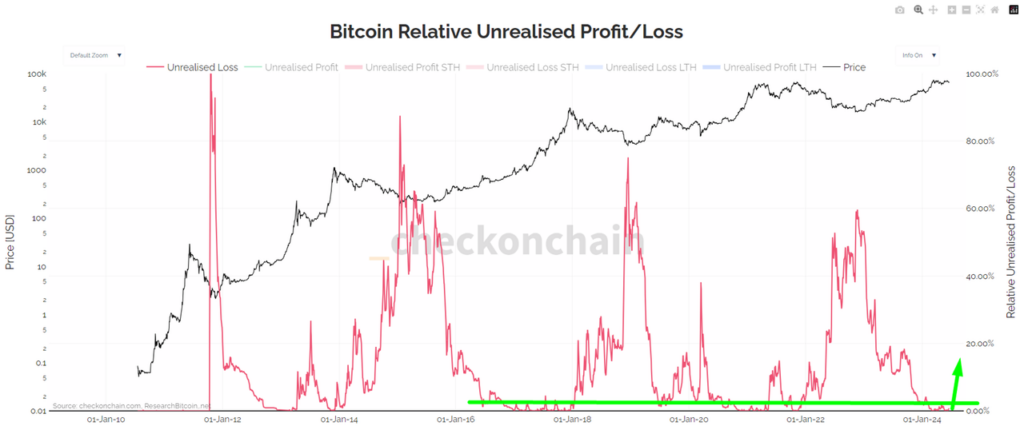
1. Bitcoin Short-term Holder cost basis & Relative Unrealized Loss
The Bitcoin cost basis of the short-term holder is $64,000.
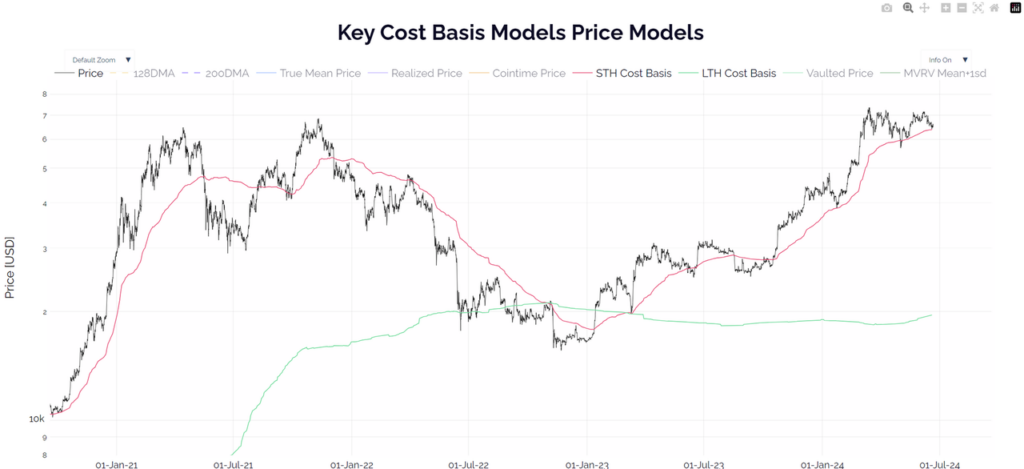
Based on the Bitcoin Relative Unrealized Loss chart (the percentage of holders with unrealized losses), the unrealized loss is currently maintained at a low level, below 2.5%. This indicates that the majority of investors are not experiencing losses and are realizing modest profits with a cost basis of $64,000.
However, if the unrealized loss increases above 5% and remains elevated for more than a week, it could signal the beginning of a decline phase for Bitcoin. Therefore, a good entry point for Bitcoin would be when the unrealized loss is between 20% and 40%.
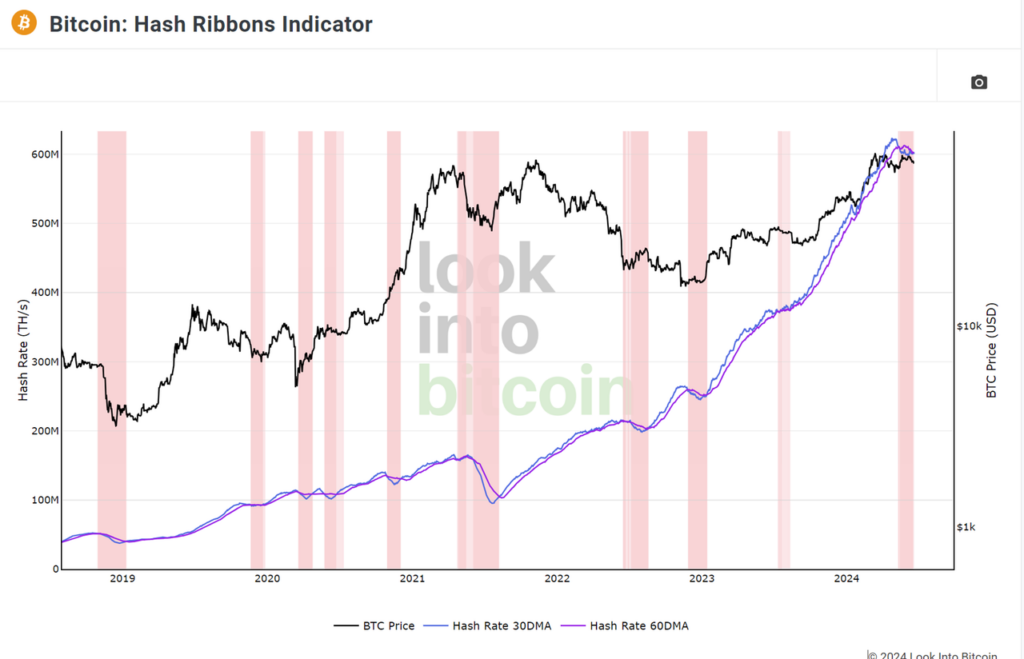
2. Bitcoin Hash Ribbons
The Bitcoin Hash Ribbons indicator identifies periods when miners are experiencing difficulties and may capitulate (cease operations). This is typically assumed to occur when Bitcoin prices are low, and it is considered a buying opportunity for investors.
The capitulation of miners usually ends when the 30-day moving average (30DMA) of Bitcoin’s hashrate moves back above the 60-day moving average (60DMA) after previously falling below it.
- 30DMA falling below 60DMA: Hashrate is decreasing, and miners are capitulating (represented by the dark pink vertical lines).
- 30DMA moving back above 60DMA: Highlights the end of miner capitulation (represented by the light pink vertical lines).
- 30DMA moving back above 60DMA and prices increasing: A return to the white color. The current situation indicates that we are in a phase of miner capitulation.
Comparing previous halving cycles:
- Halving 2016: Hashrate recovery took 24 days
- Halving 2020: Hashrate recovery took 8 days
- Halving 2024: Hashrate has not yet recovered, and it has been 61 days, which is significantly longer than the previous two halving events.
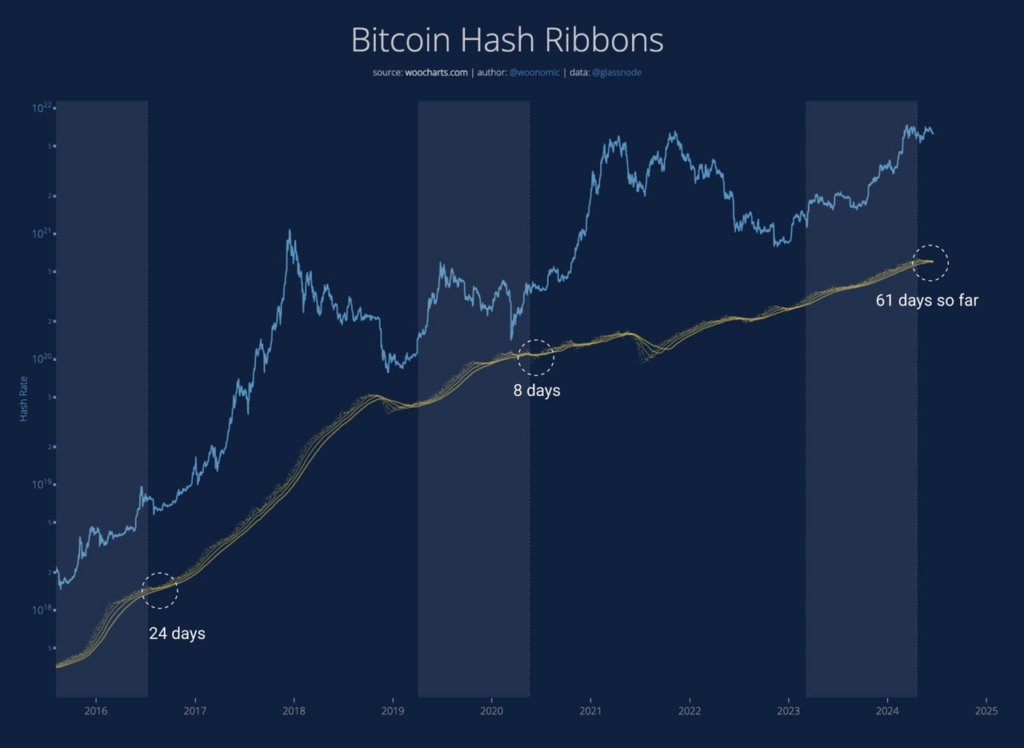
This suggests that Bitcoin’s recovery will be driven by strong xminer capitulation and the subsequent hashrate recovery.
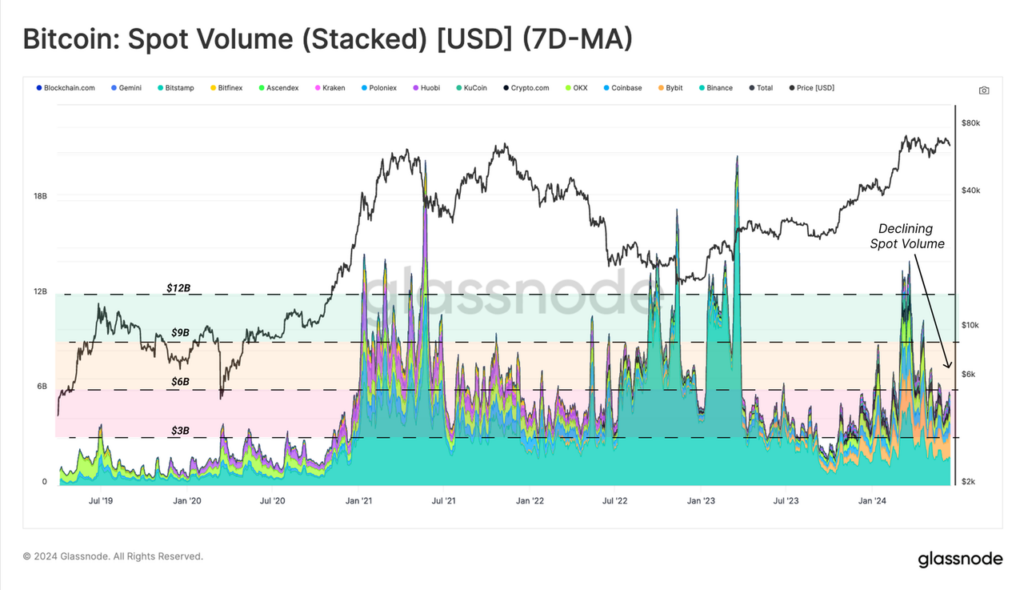
3. Spot Volume
The spot trading volume has shown a significant decline after reaching an all-time high in March, indicating a lack of market enthusiasm and a sense of market fatigue.
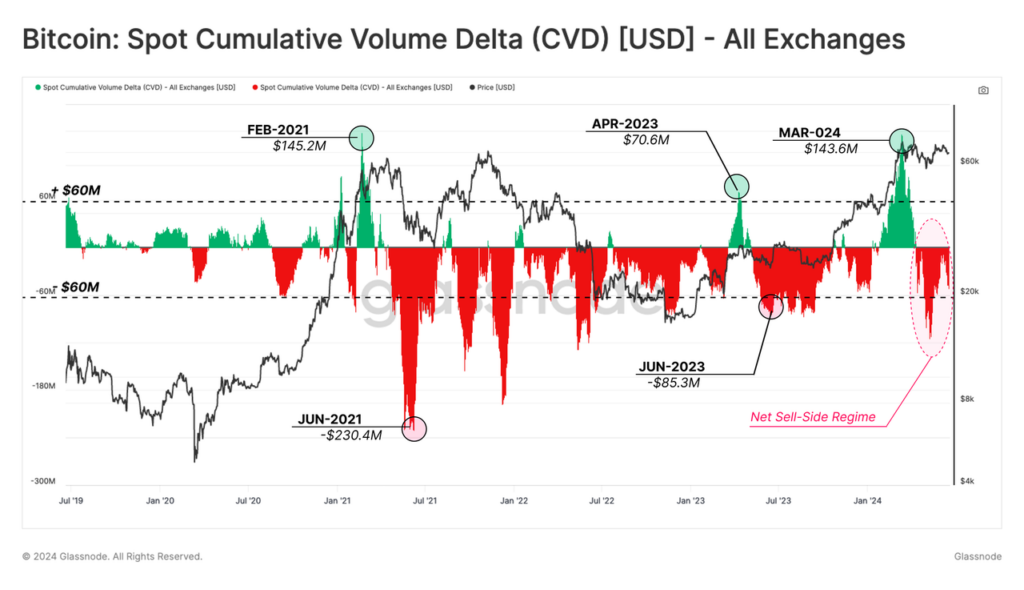
4. Cumulative Volume Delta (CVD)
The CVD indicator, which describes the net difference between buy and sell volume in the spot market, suggests that net selling pressure is dominating the market. However, the market has been trading in a sideways range of $57,000 to $74,000, indicating the presence of buying pressure that is equivalent to the selling pressure, keeping the market in a consolidation phase.
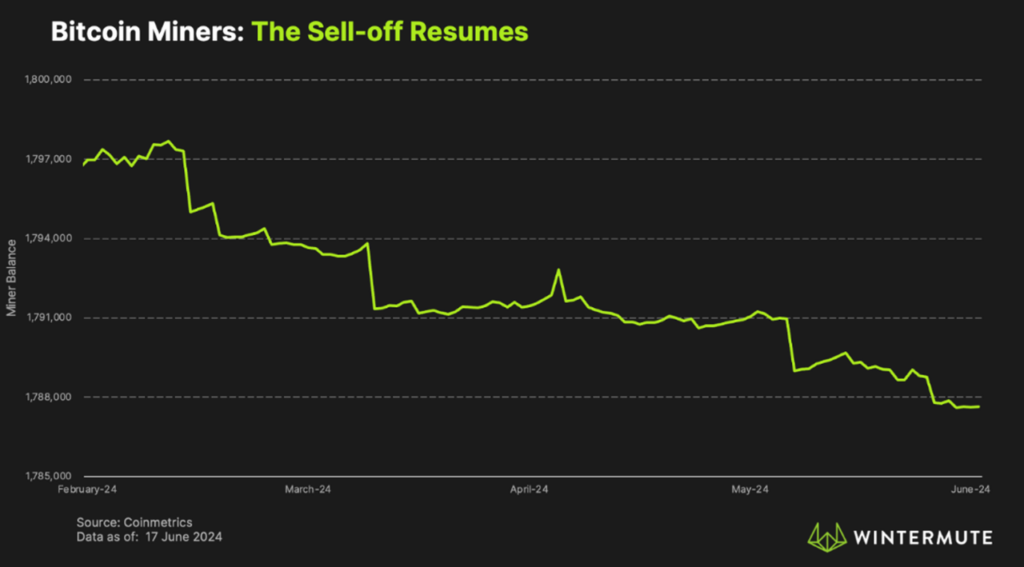
5. Selling Pressure
5.1.Miners: To prepare for the halving event and adapt to the current market conditions, miners have started selling their Bitcoin holdings, selling a total of over 27,000 BTC. However, the reduced profitability after the halving has led to continued selling, with an additional 3,500 BTC sold since mid-May.
5.2. Mt. Gox Repayments: There is also concern about potential selling pressure from the repayment of Bitcoin to the creditors of the Mt. Gox exchange, with a total of 137,890 BTC (worth approximately $9.4 billion) expected to be distributed. The timing and details of this distribution are not yet clear, but it has already had some impact on the market.
6. Buying Pressure
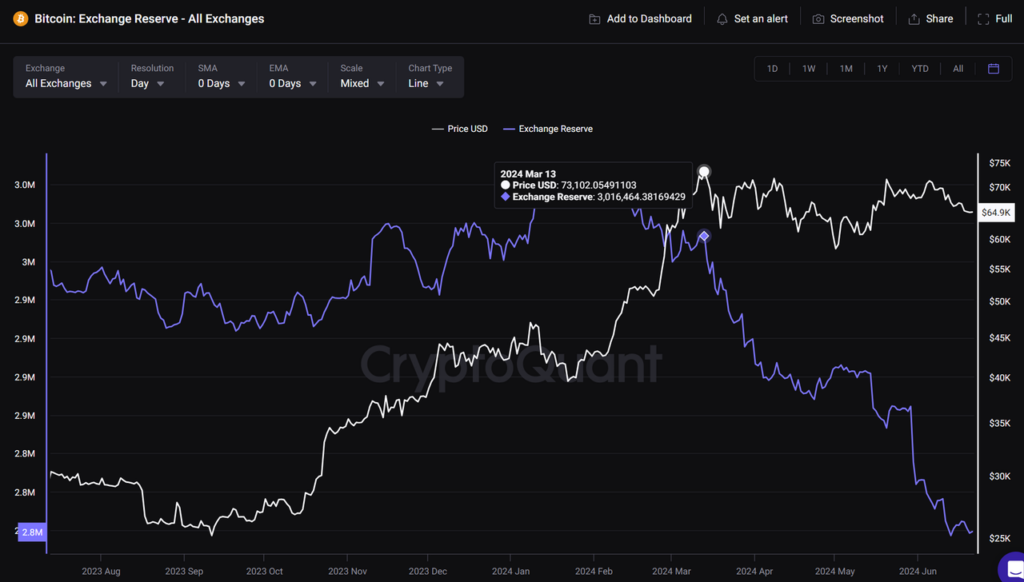
The buying pressure is not yet clearly reflected in any on-chain indicator, but the Exchange Balance indicator, which is commonly mentioned weekly, can be monitored. (Withdrawal = buying pressure, Deposit = selling pressure).
From the All-Time High (ATH) on March 13 until now, more than 190k BTC have been withdrawn from exchanges, with a value of around $12.5B → a strong accumulation trend.
7. Conclusion
In summary, BTC is currently consolidating for more than 2 months in the range of $57k – $74k. This is an important price range after the April halving. Therefore, it is always important to be prepared for various scenarios. If BTC experiences a significant price decline in the near future, the Unrealized Loss indicator combined with the Hashrate Ribbon can be used to identify the best buying opportunities.
The information provided in this article is for reference only and should not be taken as investment advice. All investment decisions should be based on thorough research and personal evaluation.


