Our latest research compiles the 10 essential charts guiding you through this week’s most critical macro and financial developments. From equity market shifts to crypto dynamics and commodity movements, these visuals capture the indicators every investor should have on their radar. Dive to understand the forces driving global markets and gain the insights needed to make informed, strategic decisions.
1. Learnings and conclusions from this week’s chart
- Investor Optimism on the Rise: The October Bank of America Global Fund Manager Survey shows the biggest surge in investor optimism since June 2020, fueled by expectations of Fed rate cuts, China’s stimulus, and a potential U.S. “soft landing.
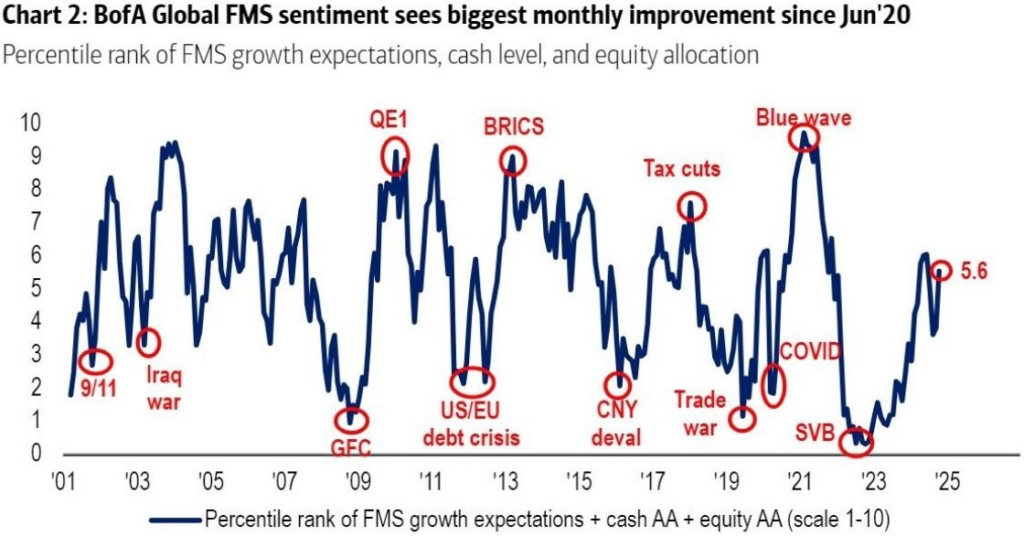
- Cash levels fell from 4.2% in September to 3.9% in October. The cash level reduction triggered a contrarian “sell signal” according to BofA’s metrics, similar to 11 previous signals since 2011

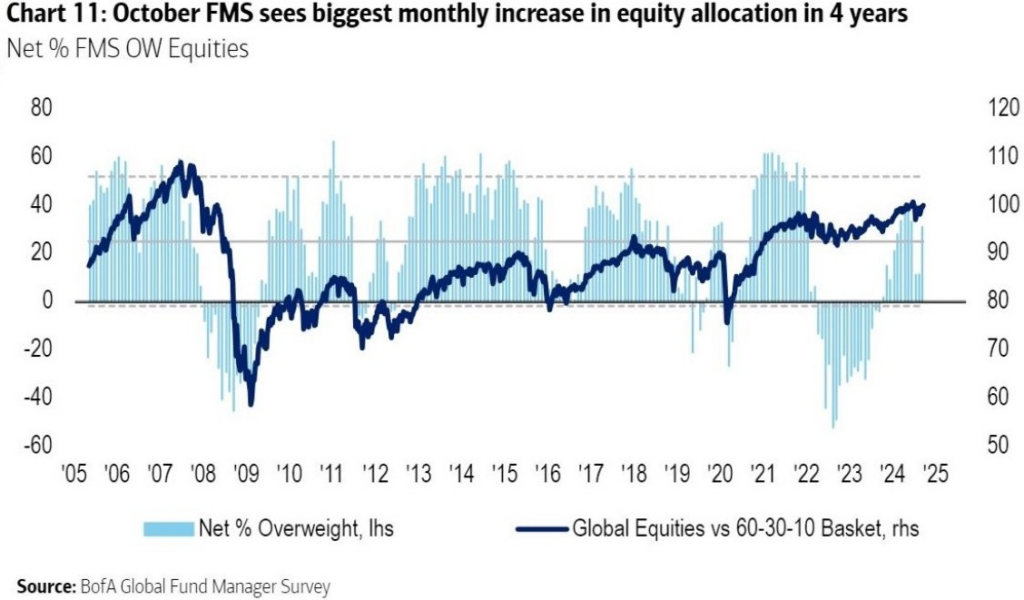
- Despite this warning sign, global equity allocations also saw a significant increase, with a net 31% overweight — the largest jump since 2020.
- Pre-Election Positioning: The S&P 500 recently reached an all-time high, but investors are now adjusting portfolios ahead of the U.S. election on November 5. A potential Trump victory could lead to higher inflation, a rising deficit, and renewed trade tensions with China. Historically, markets have shown modest positive returns leading up to elections, likely driven by anticipation and policy clarity. However, post-election reactions can be sharply negative in years marked by policy uncertainty or shifts in economic outlook based on the winning candidate’s agenda.

- Gold’s Record Rally: Gold recently reached an all-time high of $2,790 per ounce, fueled by robust central bank buying, geopolitical tensions, and expectations of looser U.S. monetary policy. ETF inflows have grown for five consecutive months, marking the longest streak since 2020.
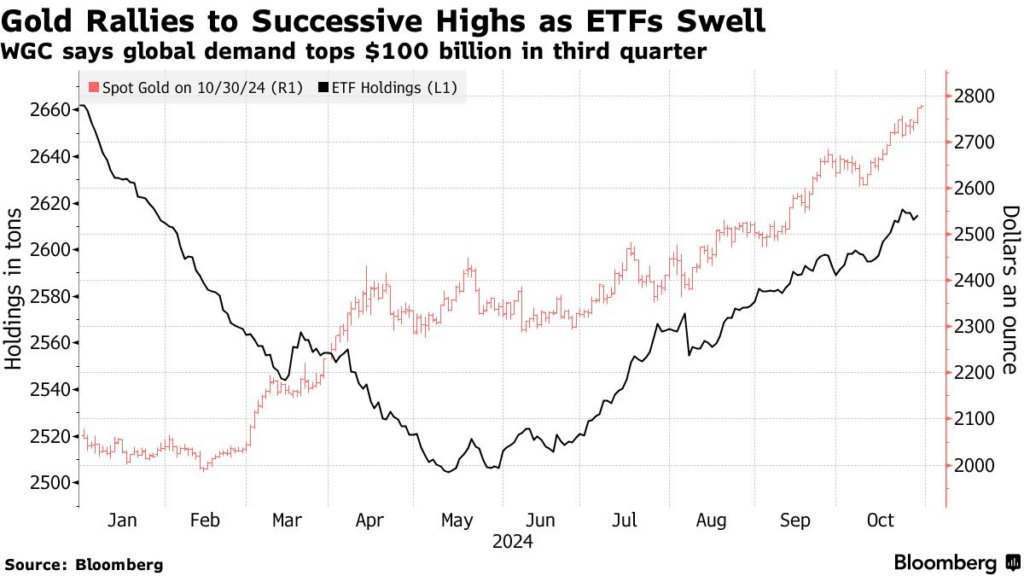
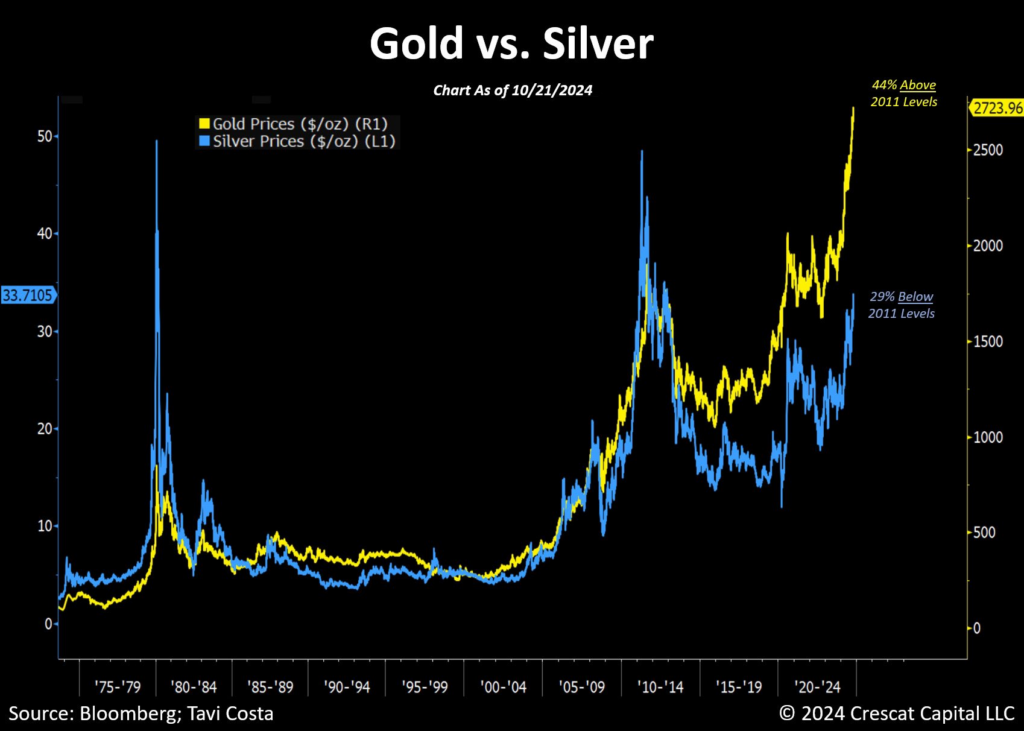
- The bullish outlook for gold points to a potential rise to $3,000, as it remains a key hedge against geopolitical and economic uncertainties. Its role in portfolio diversification further supports increased investor allocations to bullion. While gold leads the movement, other metals and commodities like Silver warrant attention as they often follow Gold’s trajectory.
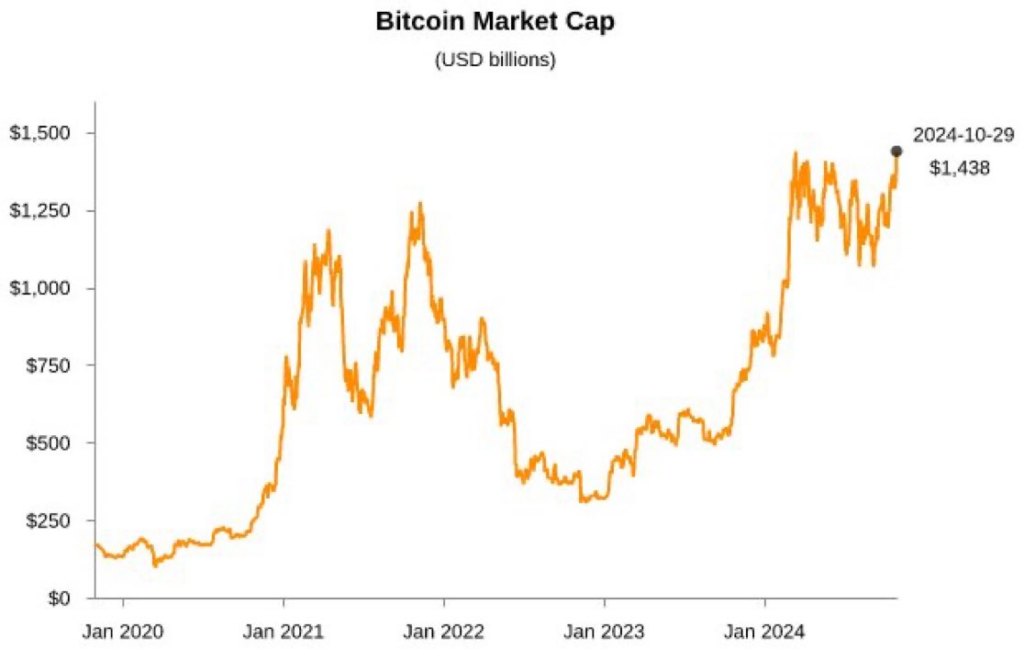
- Bitcoin’s Mainstream Adoption: Bitcoin’s market cap is nearing $1.5 trillion, driven by aggressive ETF purchases totaling $5 billion this month. Daily BTC supply falls short of ETF demand, creating a 3-5x imbalance. We believe Bitcoin is at a tipping point for mainstream adoption, with a strong likelihood of reaching new all-time highs soon—an outlook we’ve consistently supported in our research. During a potential parabolic bull run, an influx of retail and institutional liquidity could add $100-200 billion to the market. With a $144,000 target price, Bitcoin would reach a $3 trillion market cap—still modest compared to gold’s $18 trillion.

- Cash Reserves in Money Markets: A key buffer against falling risk-asset prices is the $6.51 trillion in U.S. money market funds—nearly double pre-pandemic levels. Inflows this year have surpassed half a trillion dollars which is significantly lower than last year’s $1.3 trillion total. As the rate-cutting cycle progresses, current yields of 5% could fall to 2-3% if inflation continues to decline. We anticipate $100-500 billion in outflows over the next 6-12 months, likely rotating into risk assets that offer higher yields than traditional deposits and low-risk instruments.

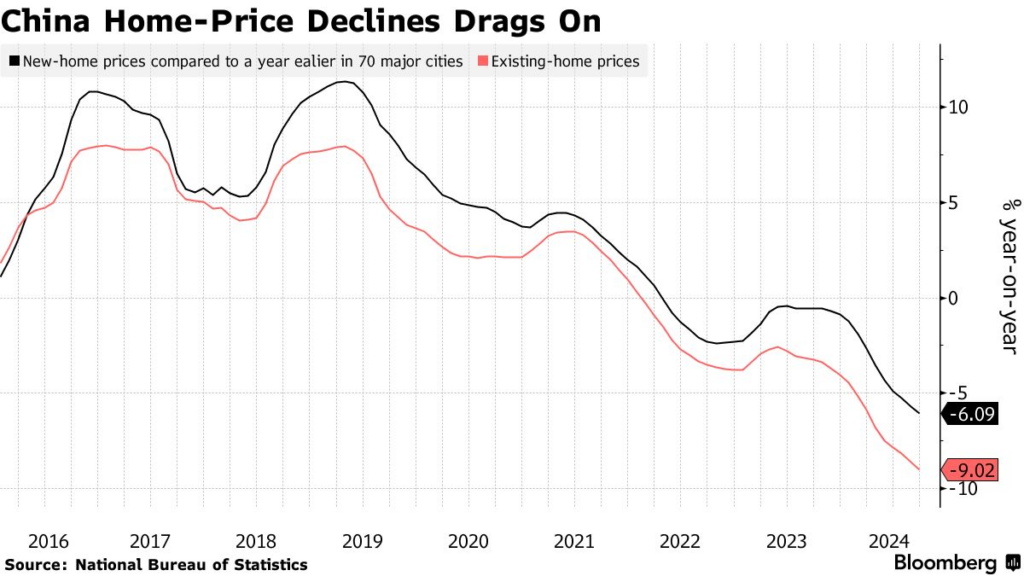
- China’s Potential Stimulus Boost: With property prices sharply declining in September, the Chinese government is expected to implement additional stimulus measures. Increased public spending and subsidies could stabilize household wealth and boost consumption. Emerging market stocks and commodities stand to benefit most from China’s upcoming stimulus.
2. Closing Thoughts
- A full-scale breakout in equity, crypto, and precious metals markets seems imminent, potentially post-election, though a short-term pullback is likely. Expect volatility over the next two weeks—avoid leverage and stay cautious of potential market fake-outs.
- The gold trade reflects a broader investor strategy to hedge portfolios anticipating a possible Trump election victory.
The information provided in this article is for reference only and should not be taken as investment advice. All investment decisions should be based on thorough research and personal evaluation.


