1. Executive Summary
The post-election optimism and expectations of a crypto-friendly administration have fueled a remarkable surge in Bitcoin ’s price, driving it up by approximately 45% to a new all-time high of $99,588, just shy of the critical $100k milestone. Numerous altcoins have also reclaimed their March highs, with several setting new records. Over the past week, however, the market has entered a consolidation phase, reflecting a healthy pause after the rapid ascent. This moment of stagnation offers an opportunity to examine the key drivers behind Bitcoin’s price movements, as detailed in the on-chain activity analysis.
2. Bitcoin market cycles
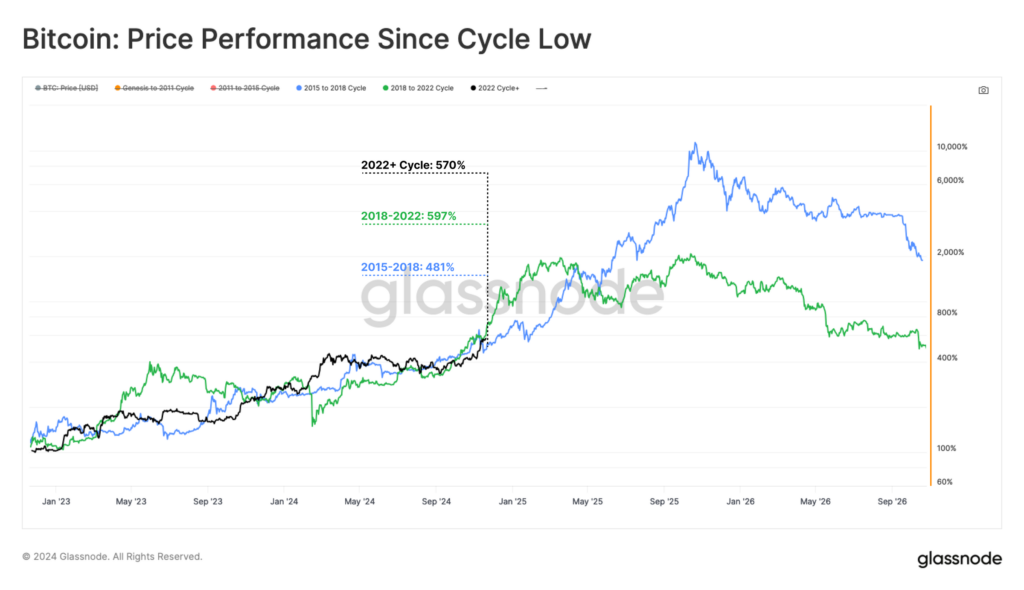
Bitcoin’s current price movement aligns strikingly with historical patterns observed in previous market cycles. The chart below highlights Bitcoin’s performance from its cycle lows during the 2015-2018, 2018-2022, and the ongoing 2022+ cycle.
- 2015-2018 Cycle (Blue): Bitcoin experienced a 481% price increase from the cycle low.
- 2018-2022 Cycle (Green): A more aggressive rally of 597%, outperforming its predecessor.
- 2022+ Cycle (Black): Currently up 570%, mirroring the 2018-2022 trajectory in both magnitude and pace.
Despite vastly different external market conditions, Bitcoin has demonstrated predictable macro price behavior and a well-defined cyclical structure, underscoring its resilience. With the current cycle still unfolding, projections suggest the possibility of continued growth for an additional 4 to 11 months, consistent with historical patterns.
3. Onchain activity
Bitcoin’s November 2024 on-chain metrics reflect a sustainable rally, supported by controlled profit-taking by LTH and rising speculative demand from STH.
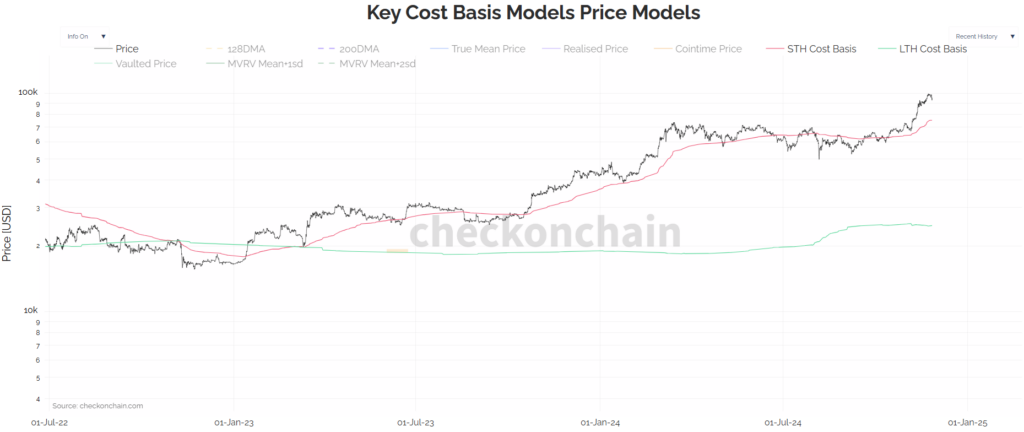
- LTH cost basis declined to $24,764 as of November 25, marking a -0.45% decrease over the past week, consistent with the prior week’s rate of -0.46%. This reflects stabilized profit-taking, indicating that LTHs are realizing gains proportionally without disrupting market dynamics. The steady decline since November 11 (-1.14%) highlights a measured approach, essential for sustaining Bitcoin’s bullish momentum.
- STH cost basis surged to $75,240, with a notable 7.36% weekly increase, up from the previous week’s 4.75% rise. This sharp growth highlights substantial capital inflows and speculative activity, typical of bull market rallies. New market participants and speculative traders fuel demand, driving higher price momentum.

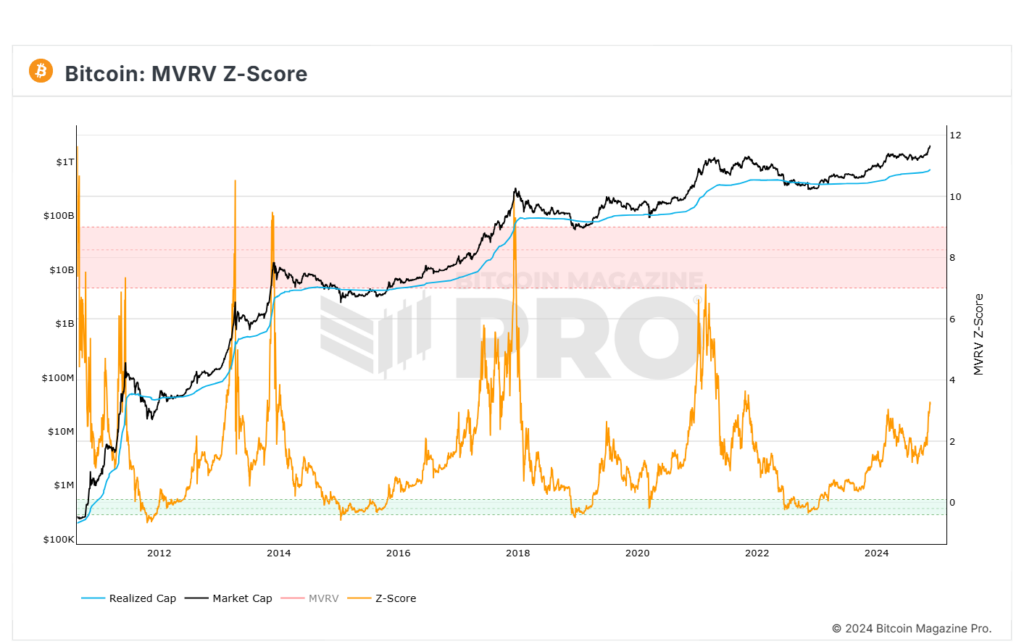
The MVRV Z-Score, now at 3.22, signals that Bitcoin’s market is in a healthy early-to-mid bullish phase.
- This surpasses the previous peak of 3.06 from March 2024 and approaches the critical level of 3.66 seen in October 2021 during the last bull market’s height.
- The current level suggests significant room for growth before the market enters the speculative or overheated territory, typically marked by Z-scores exceeding 8, as observed in the speculative bubbles of December 2017 and April 2021.
-> Watch for Z-score levels approaching 5-6, as this could indicate increased speculative activity and the potential for a short-term correction.
The combination of these metrics highlights a robust supply-demand dynamic, where speculative inflows and new capital are sufficient to absorb the selling by LTHs, allowing for sustainable price growth.
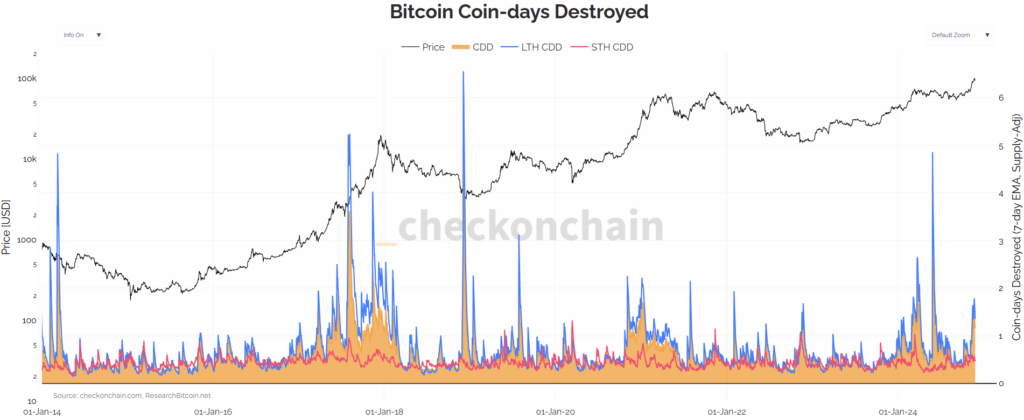
- The current CDD value of 1.84 signals heightened profit-taking by LTH, a typical behavior in bullish markets. However, this value remains below the critical threshold of 2, observed during prior cycle peaks like March 2024, suggesting that LTH profit realization is controlled and proportional to market activity.
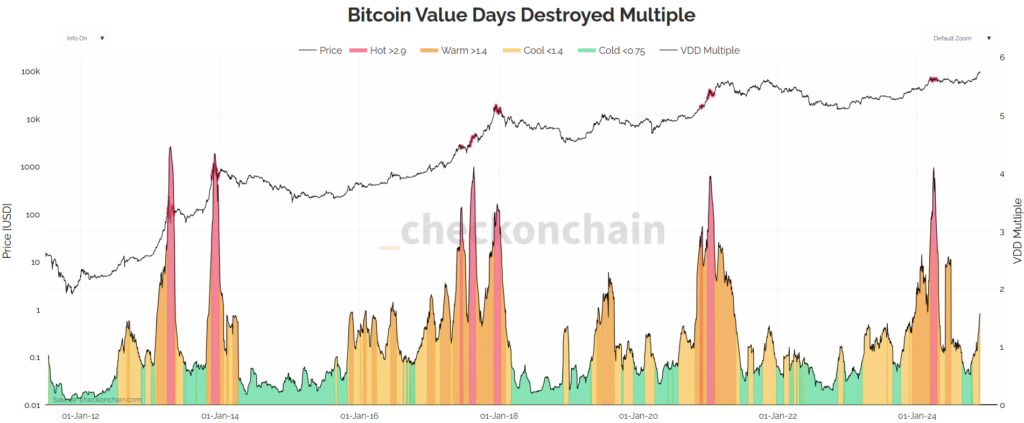
- Simultaneously, the VDD Multiple has risen to 1.5, entering the “Warm” phase, but staying well below the “Hot” threshold of 2.9. This indicates that while LTH profit-taking has increased, it remains measured and does not exert excessive selling pressure on the market.
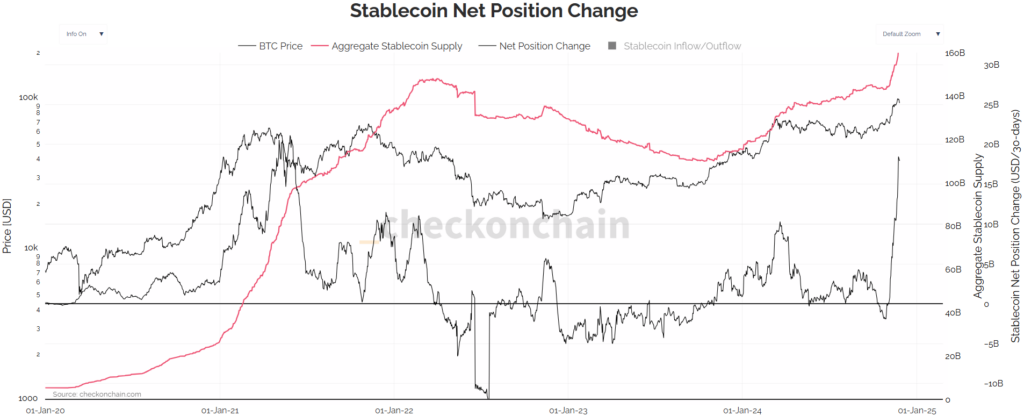
- The recent surge in stablecoin metrics has significantly influenced Bitcoin’s price, driving its rally to new all-time highs. Since November 5, 2024, the aggregate stablecoin supply has grown by $14 billion, injecting substantial liquidity into the crypto ecosystem. This influx of liquidity has been accompanied by an $18 billion surge in stablecoin balances on exchanges, reflecting heightened market activity and speculative demand. These inflows have provided robust buying support for Bitcoin, ensuring its bullish momentum remains intact despite profit-taking by LTH mentioned above.
4. Conclusion
Bitcoin’s remarkable ascent to $99,588 has been driven by a powerful combination of robust liquidity inflows, rising speculative demand, and its historically predictable cyclical behavior.
On-chain metrics reflect a market poised for continued growth, supported by measured profit-taking and strong capital inflows. This balance between supply and demand ensures that the current rally is sustainable, providing both traders and investors with a strategic opportunity to ride the momentum.
The information provided in this article is for reference only and should not be taken as investment advice. All investment decisions should be based on thorough research and personal evaluation.


